A simple tool to analyse the production process of your factory Manufacturing


With mia analytics, real-time evaluations, quality dashboards and production dashboards are available from anywhere at the touch of a button. This means that employees know what is happening in production at all times and no longer have to chase information endlessly.


Production dashboards
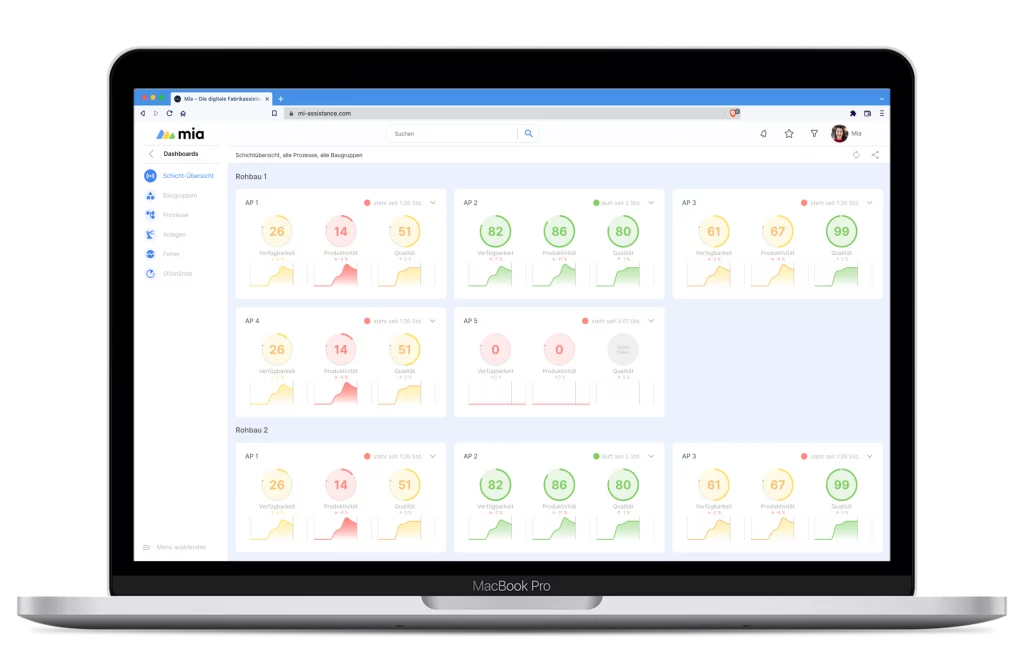
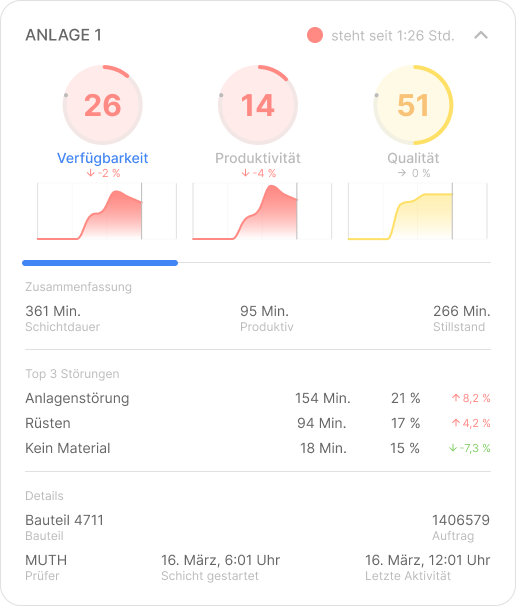
As a production manager, it’s easy to keep track with production dashboards and know in real time which plant is producing and which needs attention.


Quality dashboards
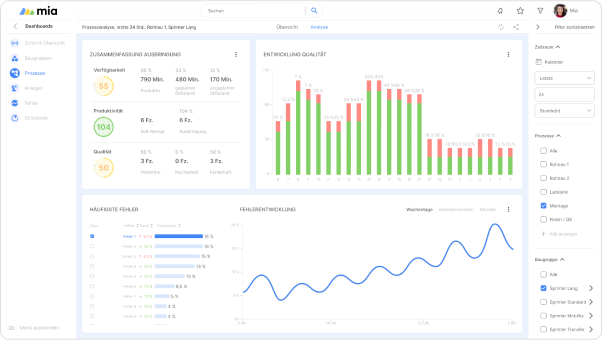
Quality engineers need up-to-date quality metrics to ensure delivery capability. With miaanalytics‘ quality dashboards, the relevant information is available in real time at all times.


Process dashboards
Most of the time, process engineers are busy collecting data. With miaanalytics, long-term evaluations of quality, machine malfunctions, errors, process data or even environmental data are available at any time.
Real-time dashboards
No more running after information or making phone calls. With the shift dashboard from mia, you can display all the workplaces that are relevant to you and know to the minute which workplaces need your attention.


Prioritisation of problems
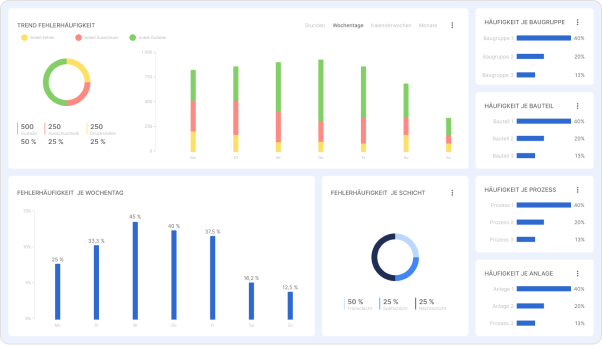
Know at any time which product has the highest scrap rate or which plant was idle the longest last month. Based on this, analyses can then be carried out in the next step to derive projects for process optimisation.
Error analysis
Know at any time which product has the highest scrap rate or which plant had the most downtime last month. Projects for process optimisation can then be derived from this.


Control production
Only with evaluated colour data can you react quickly and regain control over your production.


Control quality
With a reliable database, the right decisions can be made faster in the team, even in stressful situations


Understanding processes
In this way, causes can be identified in a shorter time based on data and the right measures can be derived from them.


"With mia analytics, we have won back the trust of our customers and reduced our waste from 60 % to 5 % within three months. Today we are even at 3%."
Siegfried Blaß, Managing Director, SeatTec GmbH